The determination of valve flow coefficients
Using parametric computational fluid dynamics methods

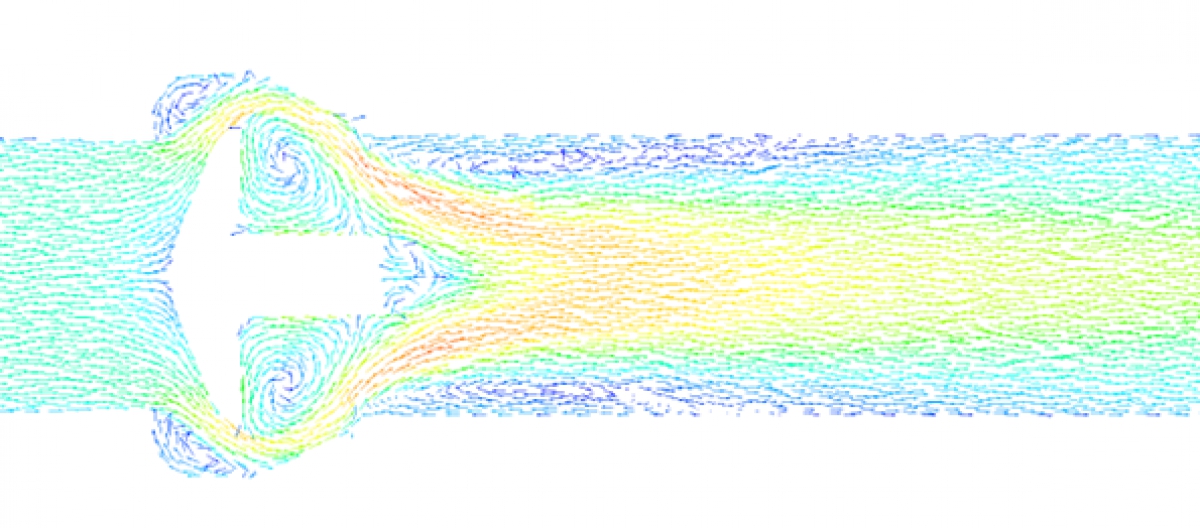
Velocity vectors plotted on a plane through the central axis.

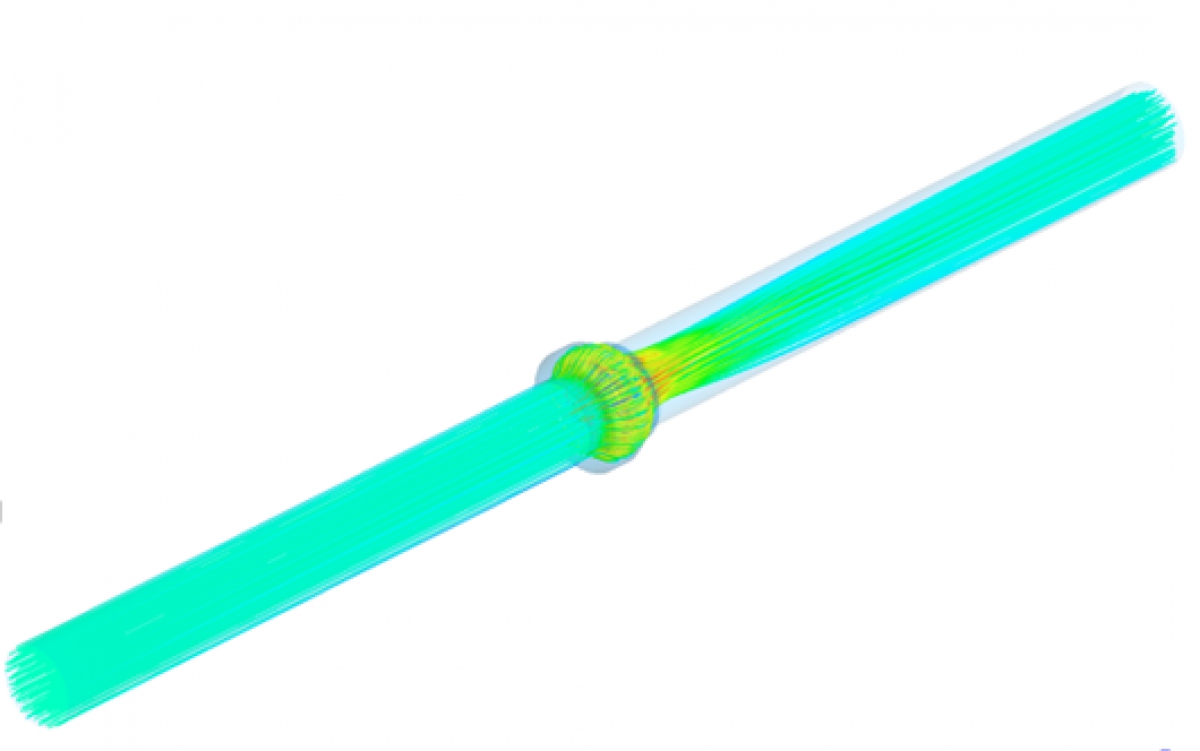
Velocity streamlines

Scan the QR code to visit the PDL valves webpages
The analysis experts at PDL Engineering Group have worked on many interesting valve and actuator projects to solve challenging technical problems for clients who rely on them to validate, understand and optimise their systems for complex projects in sectors including oil & gas, nuclear, renewable energy, water and transport.
PDL was approached by a client who designs, manufactures and distributes a range of industrial valves, instrumentation and associated equipment. The client was developing a range of 20-off phase check valves in both “long” and “short” patterns that were designed to protect systems and equipment from reverse flow, utilising a sprung mechanism. The client required the flow coefficient of each valve for their technical specification and validation.
The nature of the valve geometry prompted the need for 3D Computational Fluid Dynamics (CFD). The PDL team generated a parametric analytical model covering the 20-off designs using ANSYS DesignModeler to modify a series of key internal bore dimensions based on the information provided by the client.
The team used ANSYS Meshing tools to create a detailed mesh, also allowing the inflation layer thickness to be modified between valves due to variations in fluid velocity and geometry. The appropriate flow rate for each model was calculated based on the force required to fully open the spring-loaded valve and ANSYS Fluent was used to set up and solve steady-state fluid flow simulations for the valves. The force calculations were verified using the analysis results.
The calculations also checked whether the fluid flow was being choked and accounted for pressure recovery, fluid flow regime and adjoining pipe fittings. Flow coefficient vs valve size trends were plotted and CFD contour plots of pressure and velocity were provided to the client to identify any regions of high velocity, and flow patterns were compared between valves to help the client to verify the design intent.
The parametric analytical modelling meant that: significantly less time was spent on calculating flow coefficients; each valve was individually assessed; regions of high velocity and pressure were identified and there were substantially reduced costs compared to physical testing.
There are more examples of PDL analysis expertise at www.pdl-group.com
|
Tel No: |
00 44 1434 609473 |
|
Email: |
solutions@pdl-group.com |
|
Website: |
|
|
LinkedIn: |
https://www.linkedin.com/company/pdl-solutions-europe-ltd/ |

| Telephone: | 00 44 1434 609473 |
| Email: | solutions@pdl-group.com |
| Website: | www.pdl-group.com |
| More information on the PDL Solutions (Europe) Ltd BVAA Member Directory Page |
Search related valve / actuator articles: PDL Solutions (Europe) LtdIssue 81CFD & FEA


-web.jpg)


